

When you are preparing UML or SysML diagrams to explain something to someone, do you think you are making the visual in the best possible way to convey your points?
 How do you make a map?
Let’s say, your company has two offices in Spain. Located in Barcelona and Salamanca, and your boss asks you to create a map of the Barcelona office. What would be the first thing you do? Yes, you will ask its purpose because the way you prepare the map will vary depending on that.
- If the purpose is to invite someone to the office, you will prepare a map with landmarks and direction.
- If the purpose is to put it on your International website to show you have an office in Barcelona, you will prepare a big map pointing to Barcelona.
So both maps are pointing to the Barcelona office but in a different way. The person who gets the map prepared in the latter way will never be able to get to the office – well unless they have a google map..
Same applies when you make UML and SysML diagrams. You want to make sure that you prepare the diagrams that will perfectly fit for your audiences to understand what you convey.
Let’s exercise with Astah
Let me walk through how Astah can help you with preparing the diagrams.
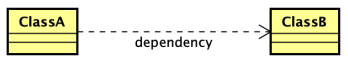
So let’s say your task is to teach how to get dependency information of ClassA by using API in the UML Class diagram below.
Your audience is someone who:
- already knows how to get the ClassA information using API
- knows UML
- has not experienced Astah API much
Is a big picture everything?
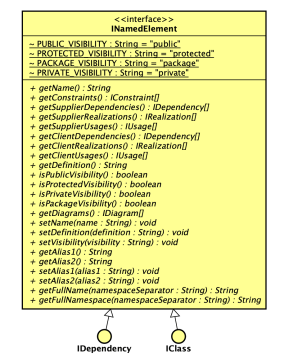
Below is a diagram that covers all the information about Interface, Attributes and Operations of all the models in the Class & UseCase Diagram Interface in Astah API JavaDoc.

This big picture has all the information about the Interface. But is this appropriate to use to accomplish your task? It may work if your audience is familiar with API already or if you can sit together with the person and talk face-to-face looking and pointing models on this diagram. Otherwise, it wouldn’t be the best presentation. Then what would you do?
This time, what you will explain is how to get “dependency”, so what you need on the diagram is INemedElement, IClass and IDependency at a minimum.
So let’s make a diagram to represent them. You can exercise this using an actual .asta file.
Let’s exercise!
1. Download astahAPI.zip, unzip and open astahAPI.asta file with Astah.
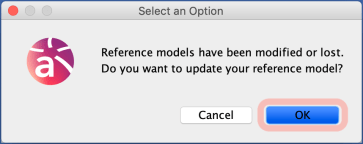
2. If the following alert message appears when opening this .asta file, click [OK].
3. Now the following message appears, click [Close].

(This appears because a sample diagram is included as read-only using the Reference Model Management feature.)
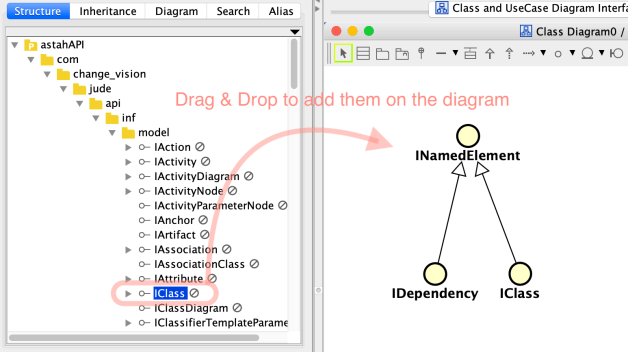
4. Create a new Class diagram and drag & drop the 3 classes (INemedElement, IClass and IDependency) to add on the diagram – probably easier if you search first in the tree view.
TIPS 1 – Switch Interface Notation
By default, Interfaces appear in circle shape if you add them from the tree. But you can choose the notations from three types.
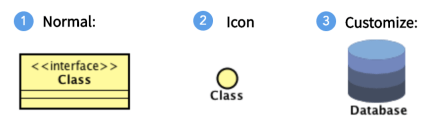
Let’s make the INamedElement Interface to a Normal one from [Icon Notation] – [Normal] from its Pop-up menu.
![]()
Now your diagram looks like this:
TIPS 2 – Hide all the Attributes
You won’t be needing Attributes of this Interface this time. So let’s hide them.

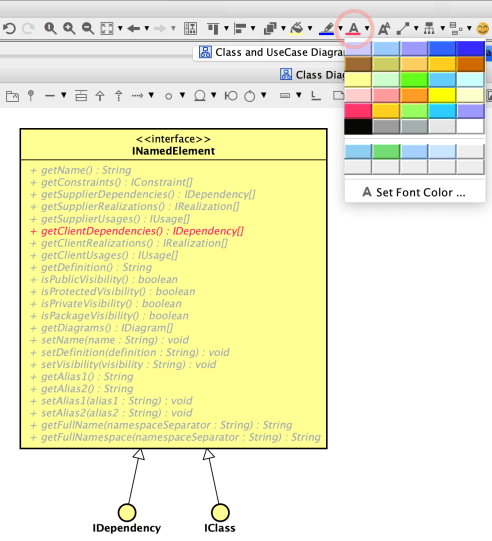
TIPS 3 – Change text color to emphasize what’s important
This interface has many operations, but what you want to show is only the getClientDependencies(). How about changing it to red and let the rest grayed out?
Probably, the person would like to know how to get the target class (ClassB) as the dependency target after all.
So let’s add the information of how to get that on the diagram. Turn the rest of two interfaces into a box shape and show Operations within IDependency. Add relationships between IDependency and INamedElement. Gray out the information (Text and line) that is not important.
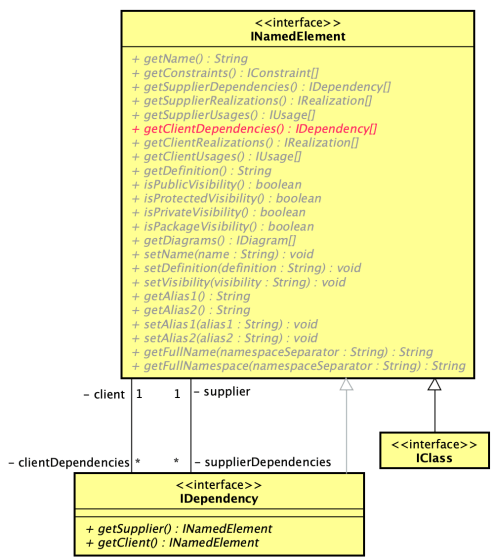
By using these visibility options, you can tweak diagrams to let them represent what you want to focus on.
TIPS 4 – Save diagrams as image files
Once diagrams are done, export diagrams to image files, paste them on the document and add comments if necessary.

TIPS 5 – Hide Attributes and Operations
At last, if you want to give a whole map to show how other objects are related to each other, you can give this diagram but is too detailed. So let’s hide all the Attributes/Operations.
Open [Initial Visibility] tab on the left-bottom pane and check off [Attribute Compartment] and [Operation Compartment] and hit [Apply to Existing elements] button.
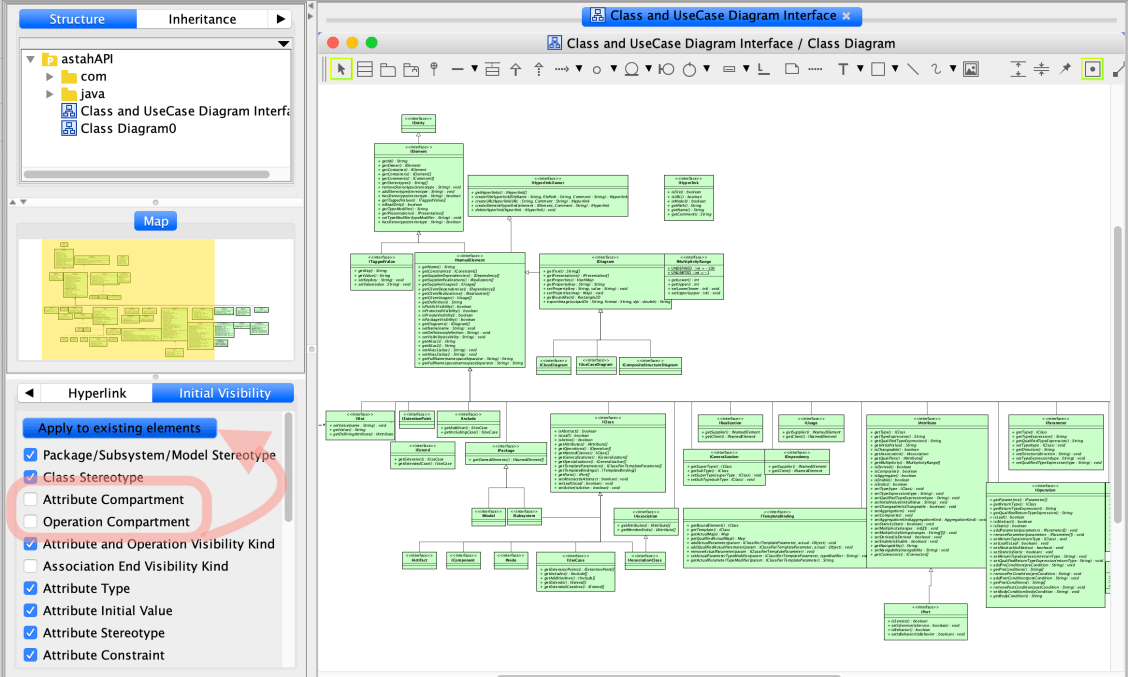
Now the diagram is all simplified and easy to see the relations.

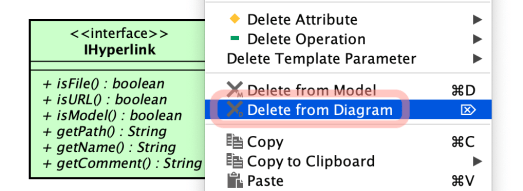
TIPS 6 – Hide objects from Diagram
To simplify diagrams even more, you can hide unnecessary objects from the diagram.
You can choose [Delete from Diagram] from object’s pop-up menu to remove it from the diagram while keeping it in the project.
Thank you!
Astah has many functionalities to make your diagram presentations to be as you’d like.
Well-prepared diagrams suited for audiences always make the communication much better and effective!
